Productions et créations numériques
Représentation graphique et interactive de données
2024 Drag & Hue
A series of simple drag and drop tools to visualize visual images. Go to the project
2024 You Tube Most Watched Viz
An experiment to visualize the most watched videos in YouTube from all time. Visit online

2024 ACM SIGGRAPH Special Projects
Special projects for SIGGRAPH 2024. Denver, Jul. 28 - Aug. 01. Exhibited in the Special Projects booth. . Go to the project
2024 The Next 50 Years
A special project for SIGGRAPH 2024. Denver, Jul. 28 - Aug. 01. . Go to the project
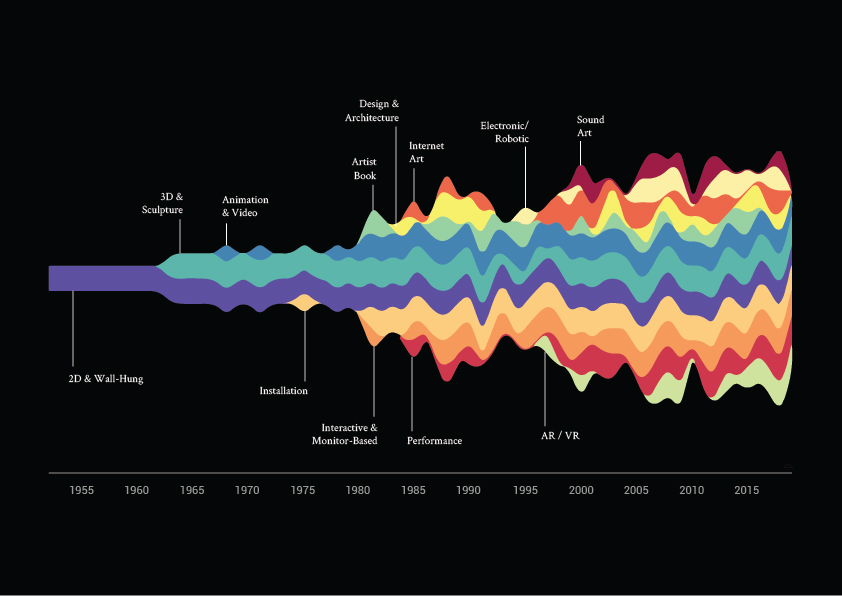
2021 SIGGRAPH Art Shows Archive
Series of visualizations of the Art Shows Archives that are managed by the SIGGRAPH Digital Arts Community.
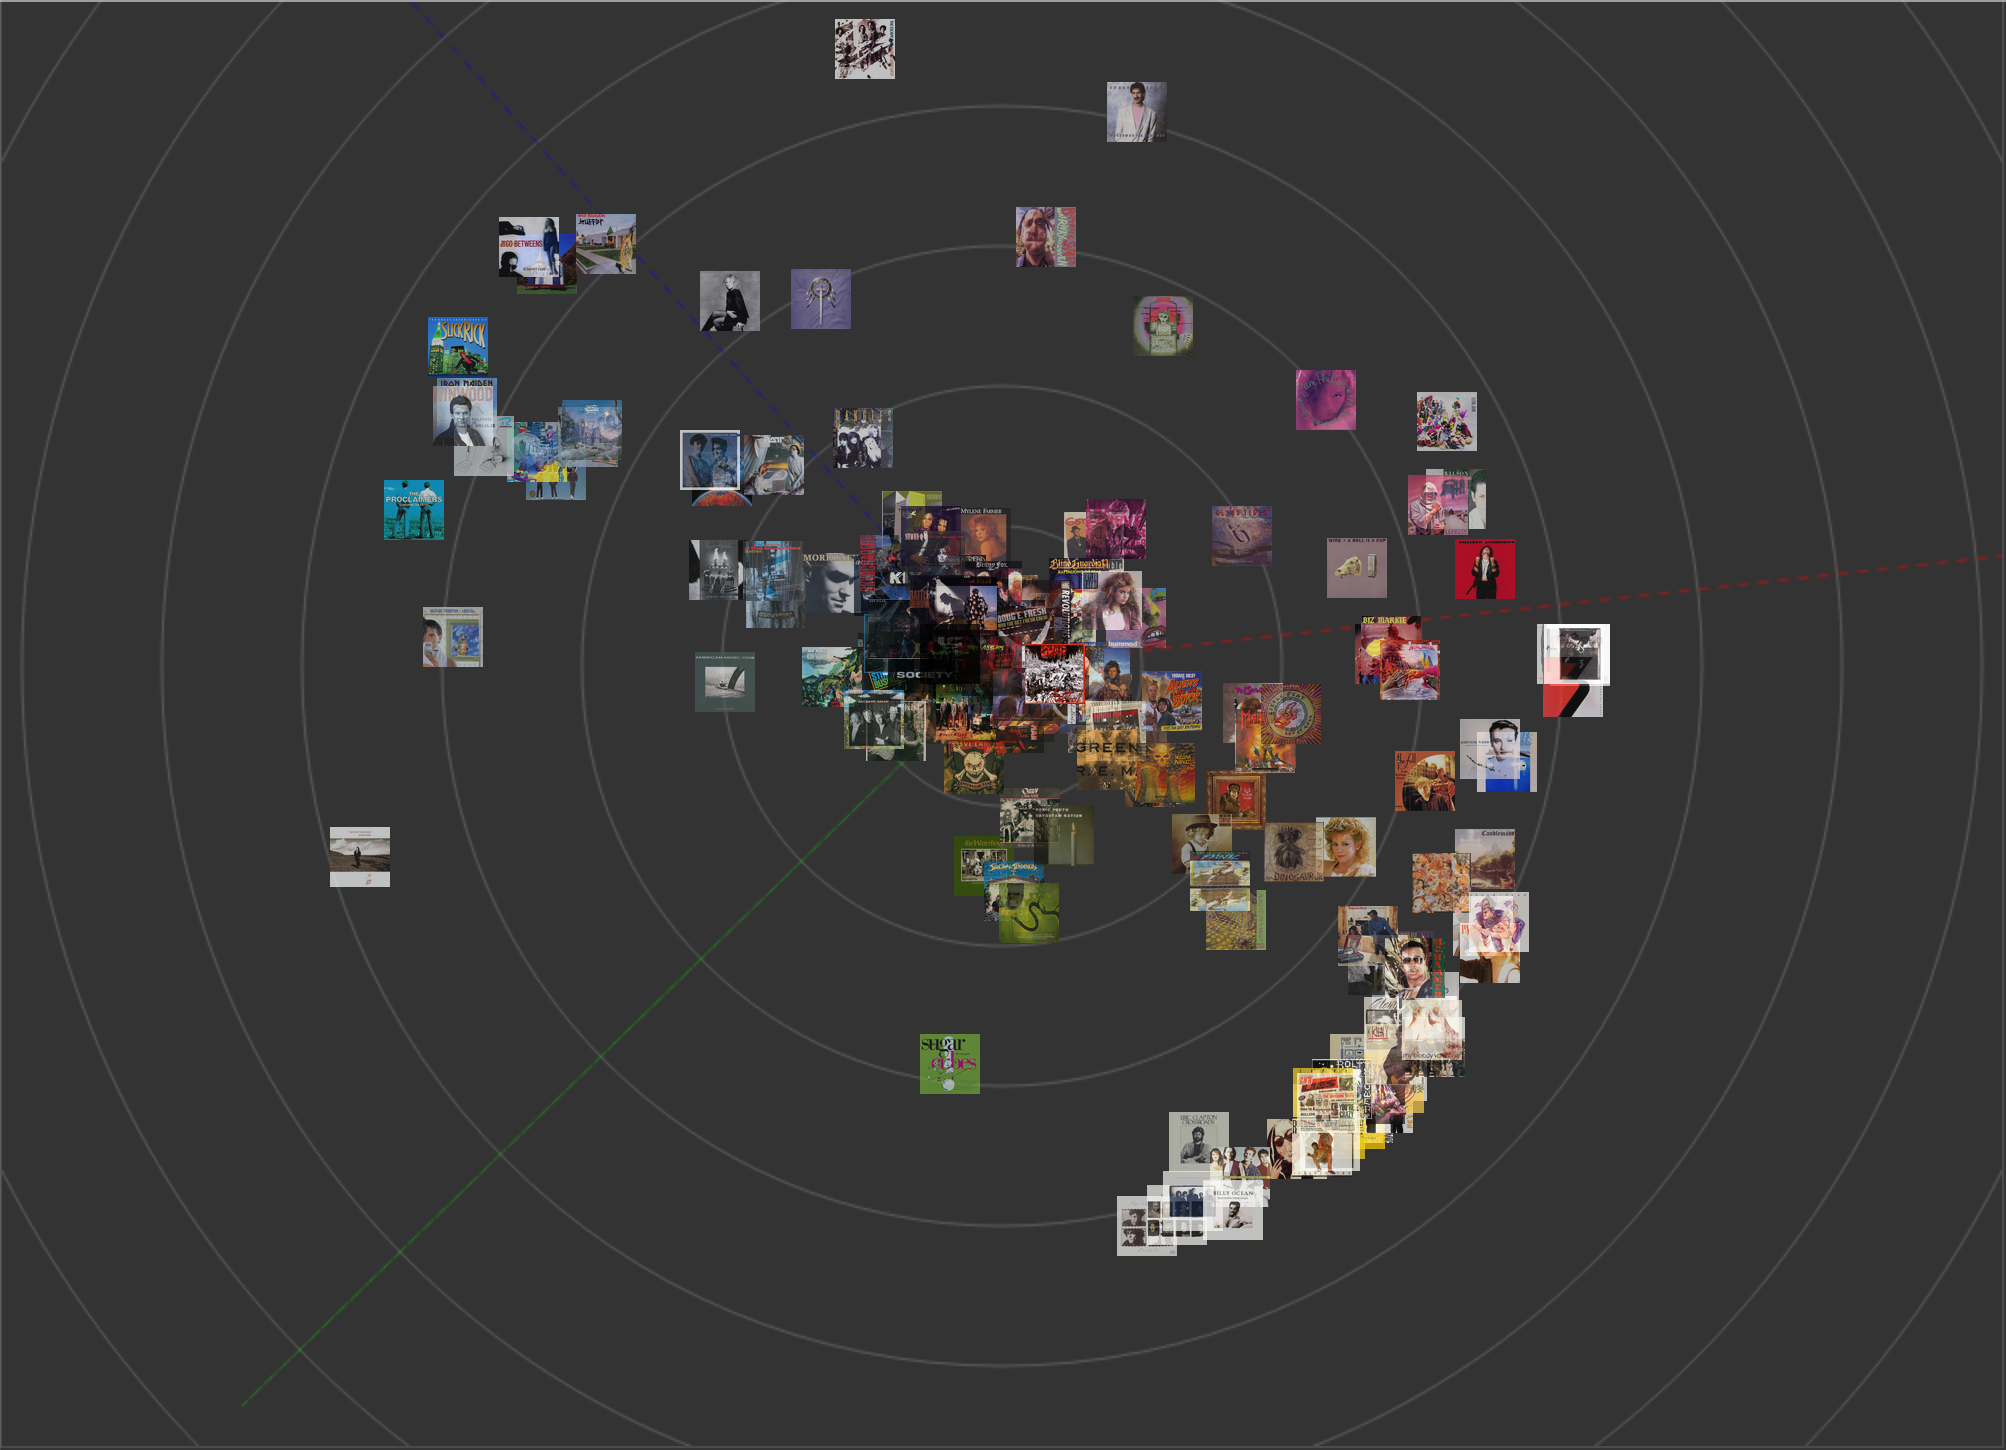
2019 K-means Radial Plot
Web-based radial plot media visualization using k-means filters. The image corpus includes all albums released in 1988 according to Wikipedia. Part of a conference paper co-signed with Lev Manovich and presented at the 12th International Congress of the AISV in Lund, Sweden.
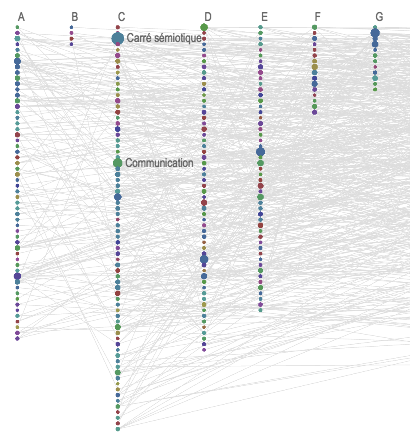
2017 Greimas Viz
Visualizing the 644 words and their relationships in the famous Greimas and Courtés' Sémiotique : dictionnaire raisonné de la théorie du langage. Voir le projet
2017 Eye Tracking Visualizer
Un prototype d'outil pour interagir avec des données eye-tracking. Expérimentations faites avec les données d'un projet de recherche de Céline Cholet
Voir le projet
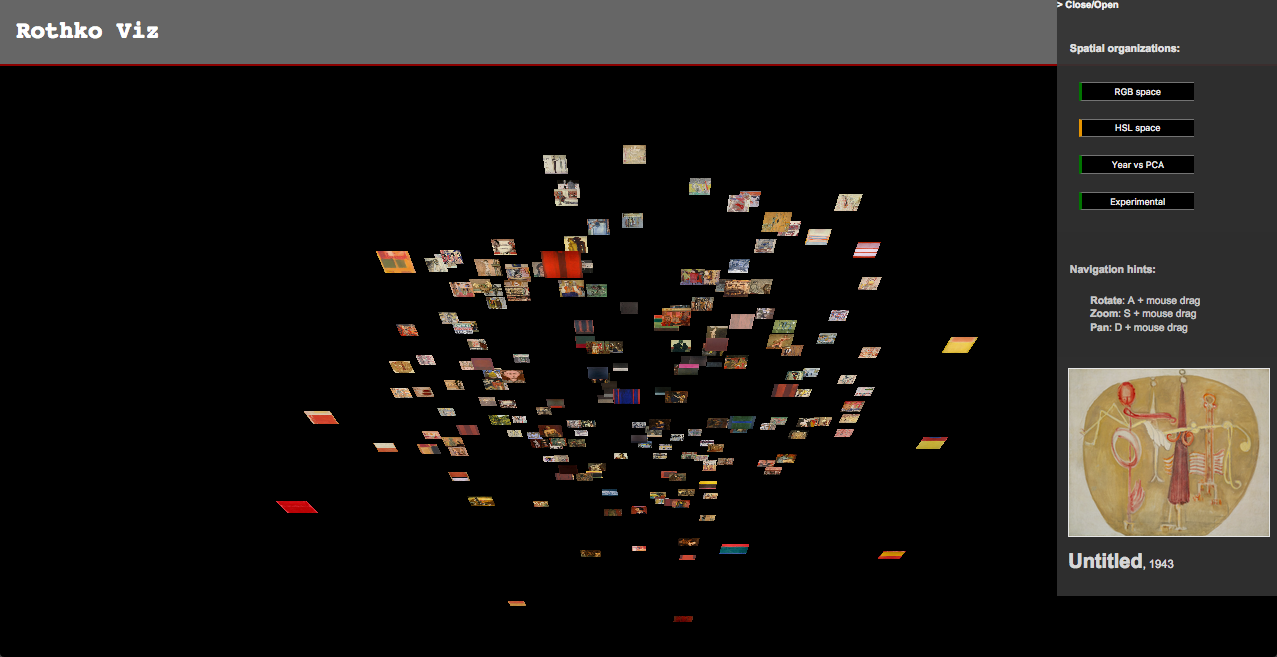
2016 Rothko Viz
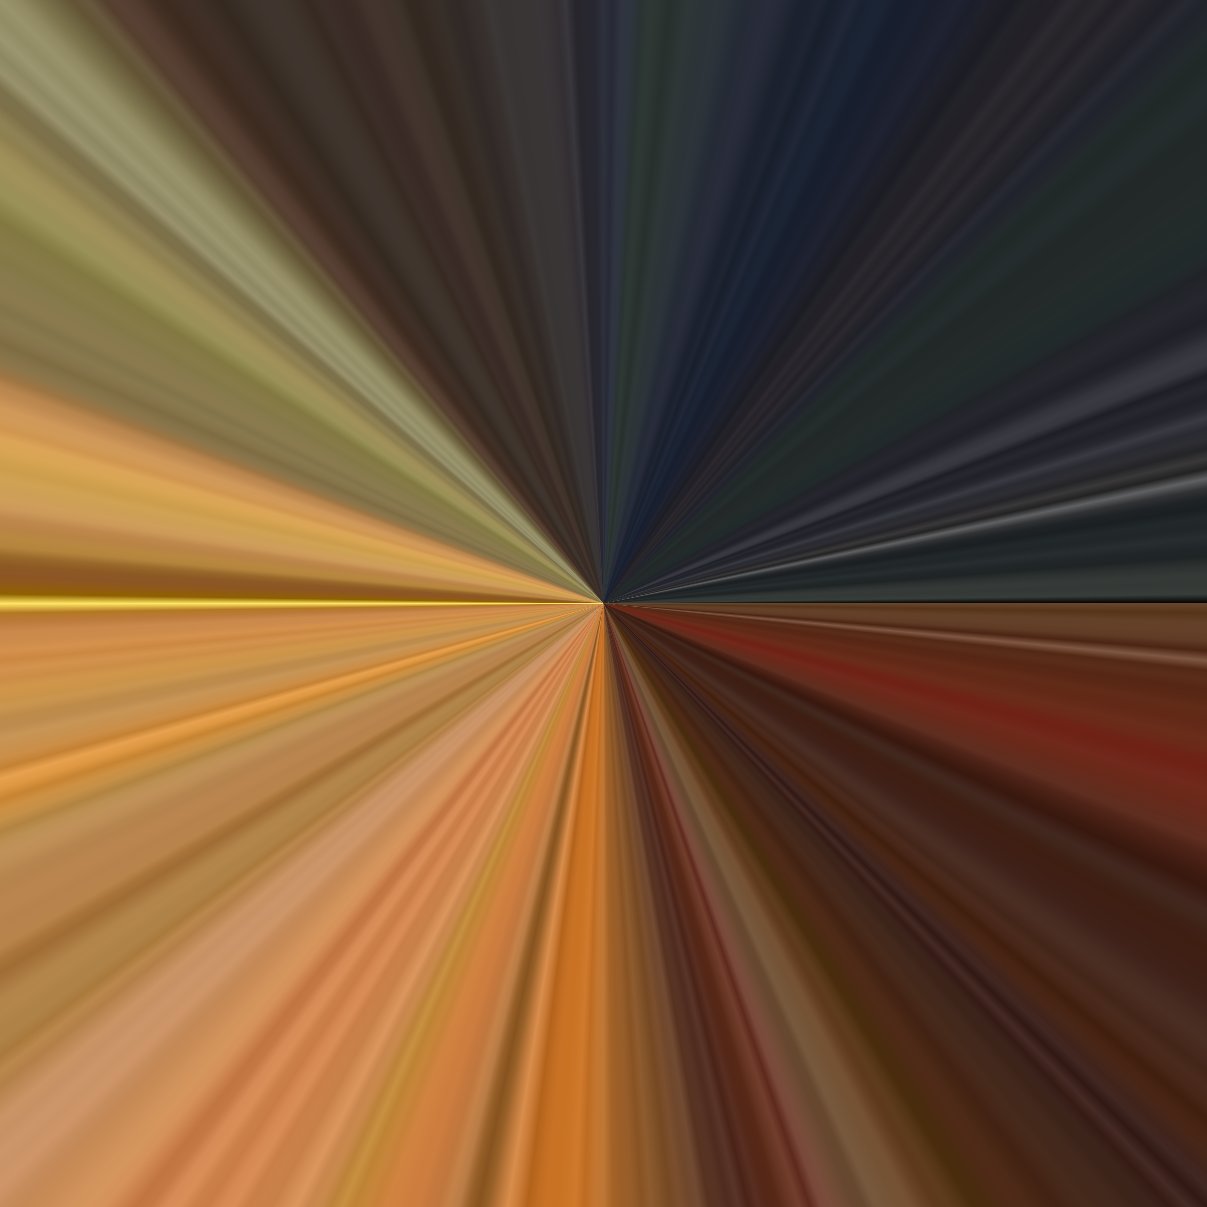
Visualizing and navigating 201 paintings by Mark Rothko using three.js. Generating images using simple rules with CSS. Voir le projet
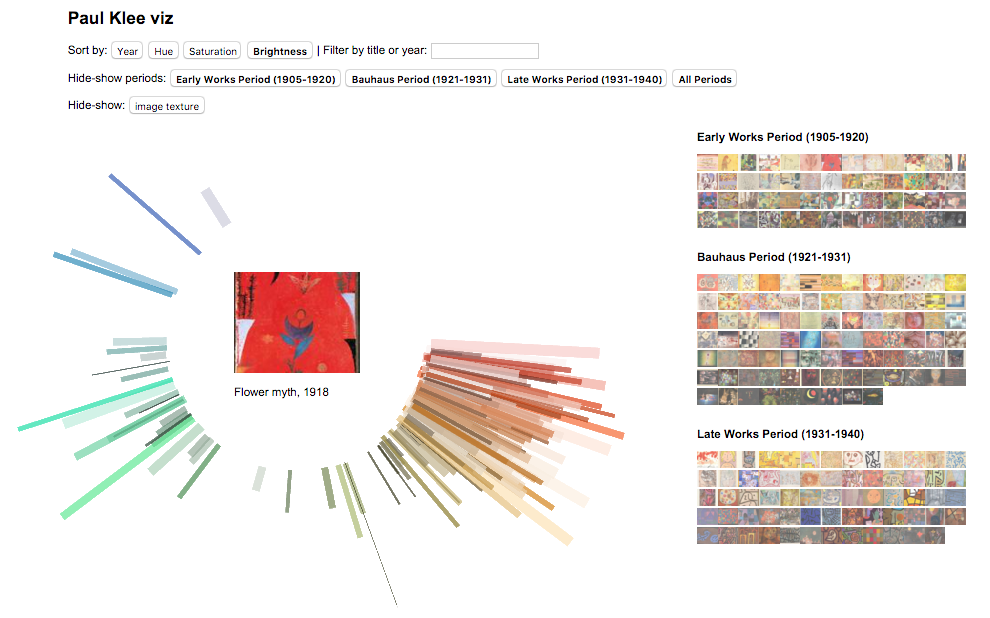
2015 Klee Viz
Visualizing 203 paintings by German-Swiss painter Paul Klee, using simple HTML, CSS, JavaScript. Voir le projet
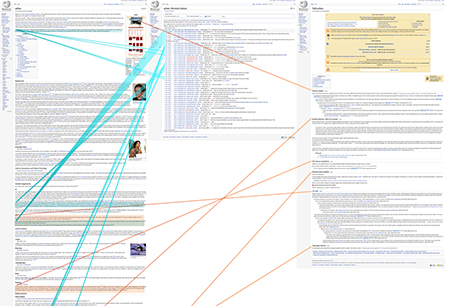
2016 Mediawiki Viz
Series of experiments in web prototypes, schemes, mockups, and interface-code analysis. Voir le projet
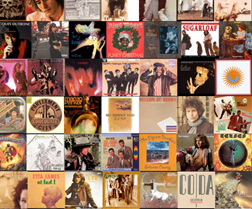
2014 RockViz
Visualizing the covers colors of the best 2000 rock albums. Voir le projet
2013 La visualité de Nirvana
An exploration of the graphical production of rock&roll band Nirvana. Visualizations made with ImageJ and Processing. Accesible in slideshare
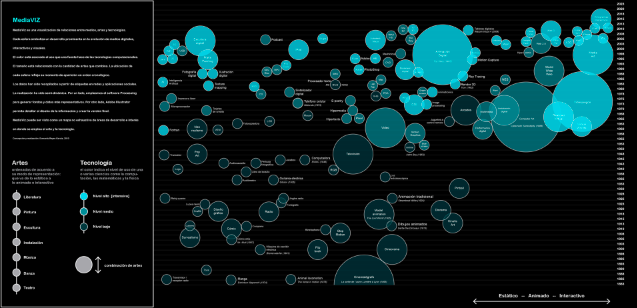
2010 Media Viz
An interactive bubble chart made with Flash and exported as SWF application. Visualization of 150 media from between 1895 and 2010.
See the project
Travaux créatifs
2025 Pixelated Ocean Shader
A shader of a pixelated ocean surface using a combination of simple sine waves and noise. Open in Shadertoy
2024 Intellect Action Figures
A series of generative images featuring vintage-style loose action figures inspired by great thinkers and inventors. View on Instagram
2024 Bestiaire d'arts et métiers modernes
Illustration des rapports multi-espèces entre les technologies, les savoirs et la nature. Fait avec Midjourney 6. Voir le projet

2023 Emoji of Life
A recreation of John Conway's The Game of Life (1970) made in p5.js, using four different emoji faces to represent the four rules of the game. Voir sur p5.js
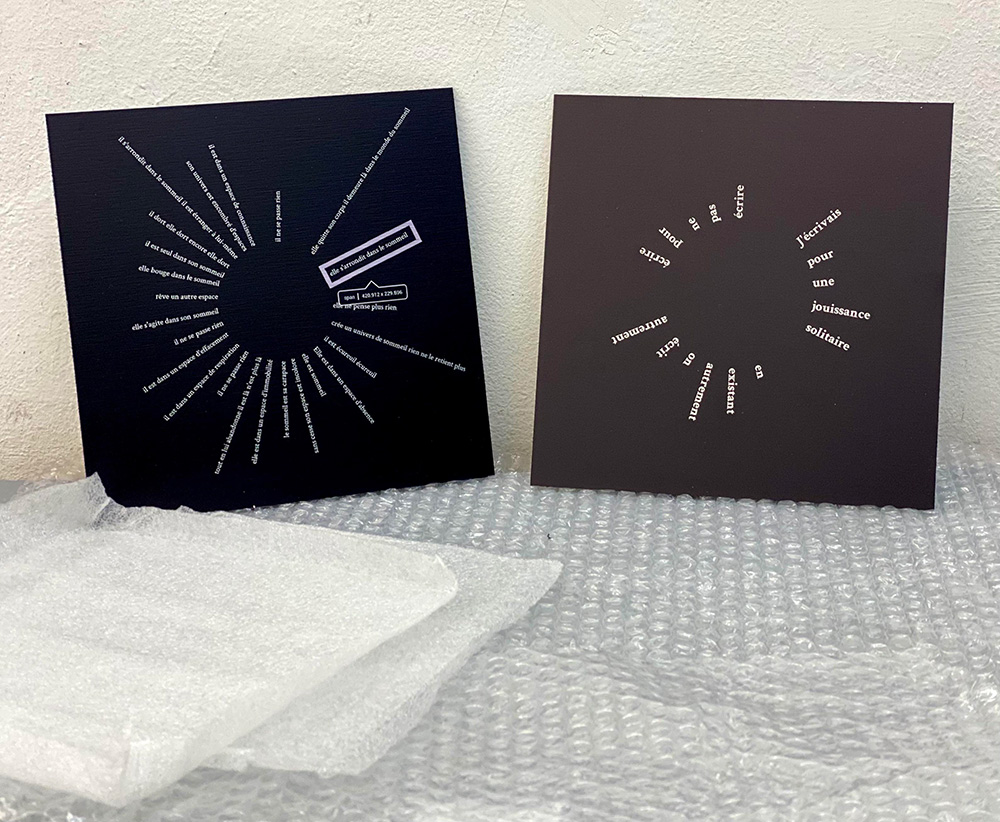
2021 Poème Stein Polaire, séries 2021
Deux impressions pour l'exposition "SATELLITE" Collective. Du 2 octobre au 4 décembre, Galerie Satellite. Impression sur Dibond 3mm. 20 x 20 cm.
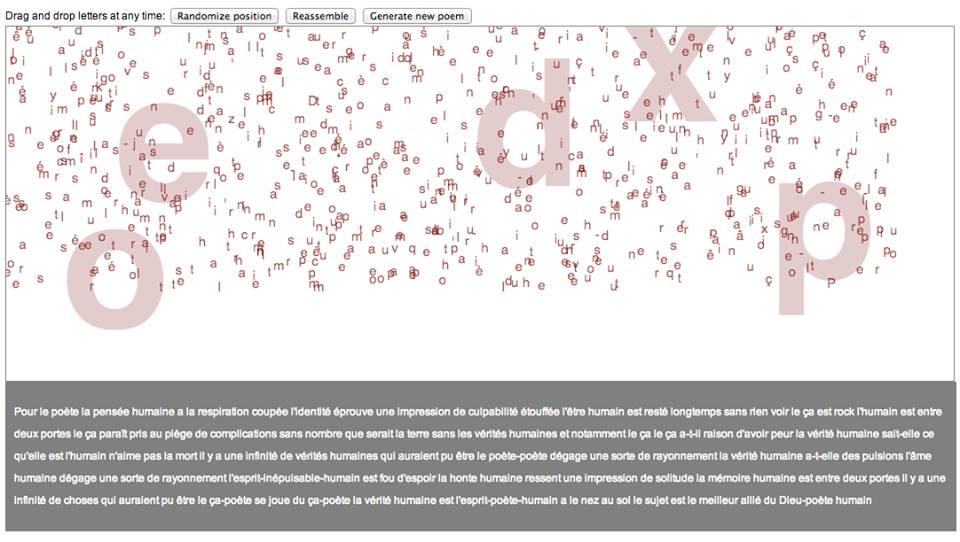
2015 - ... Poèmes Stein
An ongoing project about graphical rendering of generative poetry. In collaboration with Jean-Pierre Balpe and Sam Szoniecky. Voir le projet
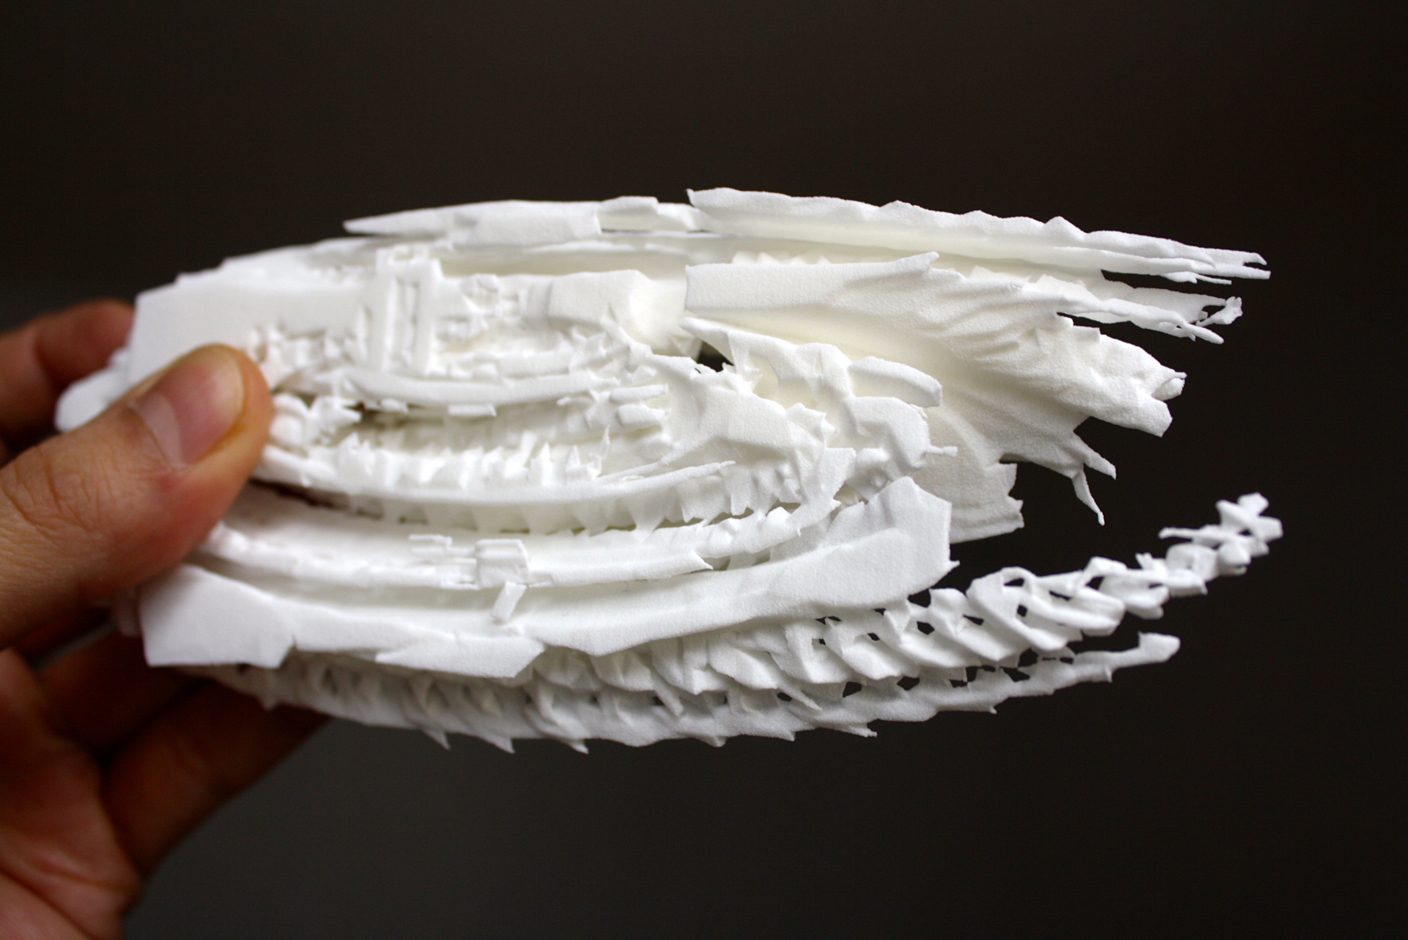
2011 - 2016 Motion Structures
A project about converting video into 3D objects. Using a script I wrote for ImageJ and 3D printing technologies. Voir le projet
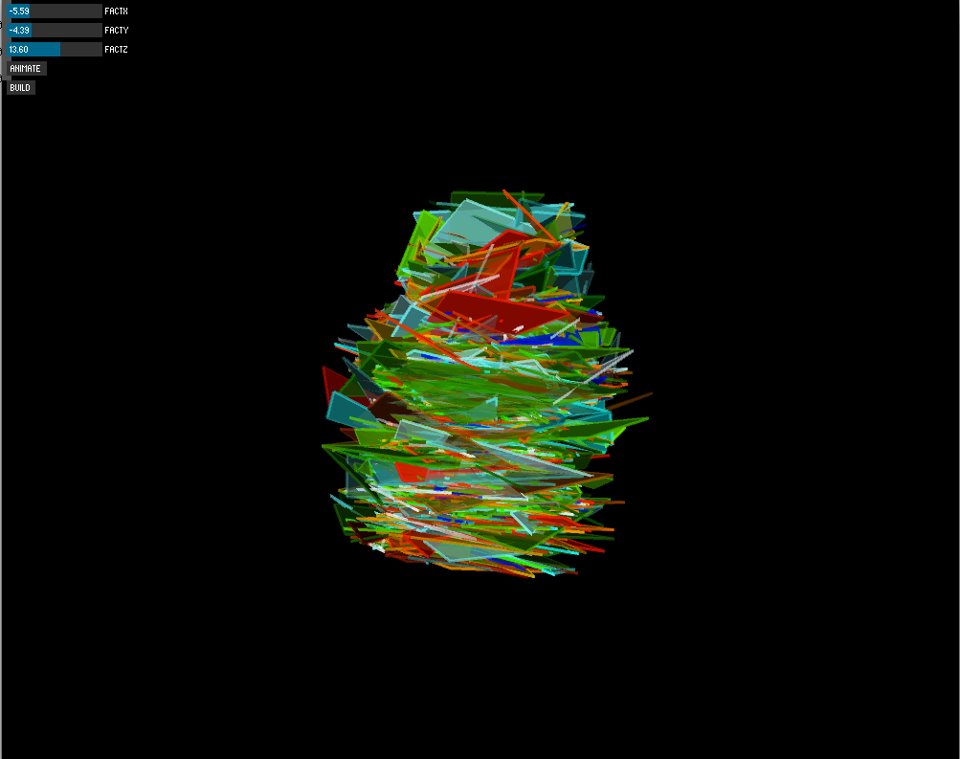
2016 Disrupting 3D Models
An experiment about breaking appart the geometry of a 3D digital model. An application made with Processing.
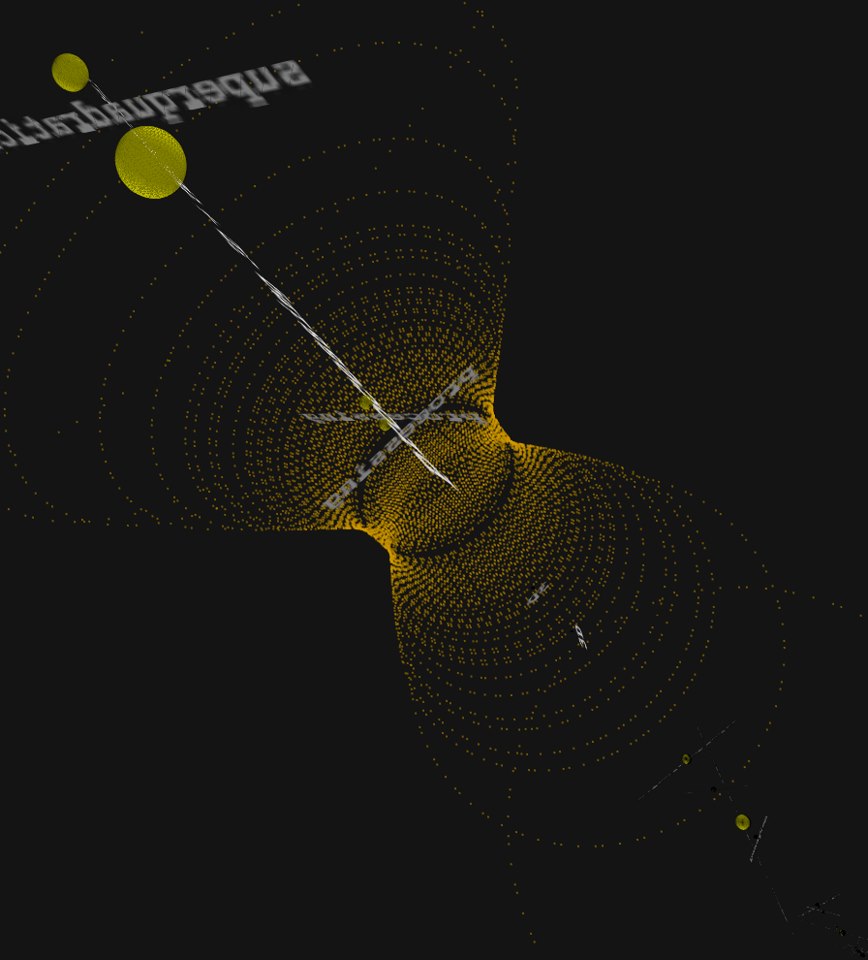
2012 Messages vers le futur
A public installation where users send future messages to themselves through a digital wormhole. Voir le projet (pour référence seulement, il est fonctionnel lors d'un événement)
2012 377 covers of Thrasher Skateboard Magazine
A short video about the evolution of Thrasher Magazine covers. Video available in Vimeo.
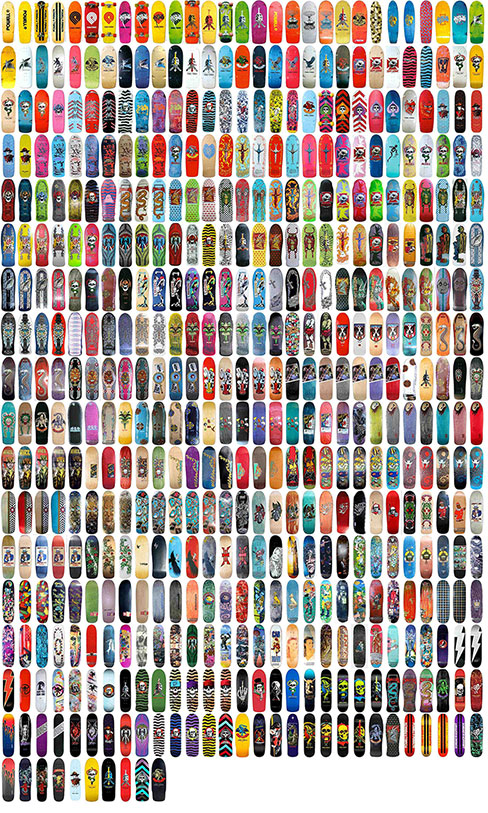
2012 500+ Powell Peralta skateboard decks
A study on the graphic design history of skateboard decks produced by Powell Peralta. View entry blog at Powell Peralta website
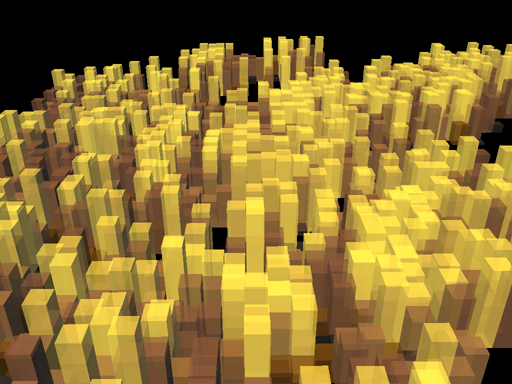
2011 Maya Fractal
A plug-in for Autodesk Maya to generate fractals and L-Systems. Voir le projet


