Visualizing the 2k. most significant rock album covers
RockViz is an exploration of 2000 rock album covers that have been classified as the 'most significant' by editors of the platform AllMusic
The Data
The music catalog of AllMusic is broadly organized by genres, subgenres, and styles. For each category, we can navigate through artists, albums, and songs highlights.
I collected data from Rovi, the data service behind AllMusic, specially on albums highlights.
My focus was mainly on Pop/Rock, but in order to have more data and see other influential genres I included Blues, Funk, Reggae and R&B.

Explorations of Chromatic Values
Digital images displayed on digital devices are understood by a combination of values according to a color model. Two of the most used nowadays are RGB (Red Green Blue) and HSB (Hue Saturation Brightness).
A simple technique to summarize colors of an image is the pixelisation technique.
From left to right: original image, pixelated at 30, pixelated at 200:


What would it look like to pixelate the 2000 images? assuming we have created a montage according to hue and brightness values.
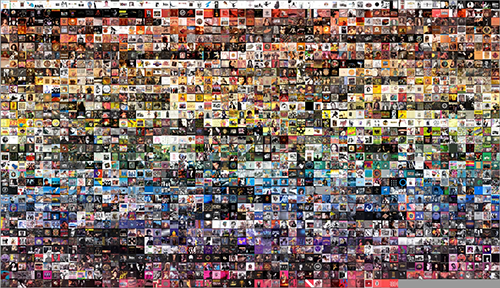
![]()
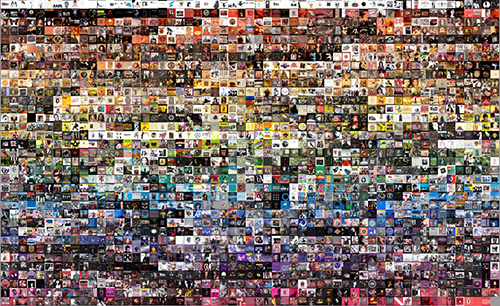
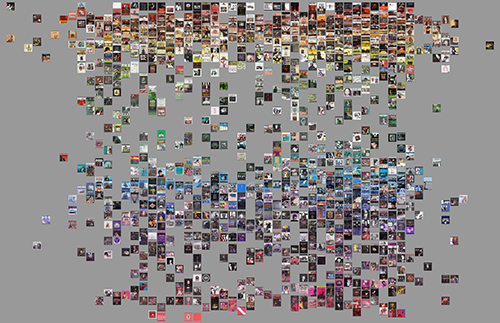
And now represented after a Cartesian 360 degree transformation:
![]()
![]()
Interactive Media Visualizations
I dynamically gathered images of albums covers from AllMusic, except in few cases whre no images were found.
The actual size of RockViz is 1994 albums covers and associated data: artist name, album title, and year. Of course, a more robust version should take into account other metadata: photographer, cover art, designer, etc.
For each image I measured chromatic features: median brightness, media saturaiton and median hue. Then, I produced different web-based visualizations of such data.
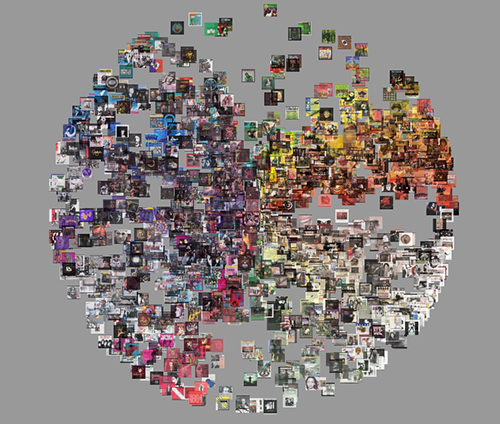
Montage of images
Images are arranged by hue and brightness values.
Plot of images
Images are plotted on two dimensions
'Years' on the X axis and 'median of hue values' on the Y axis.
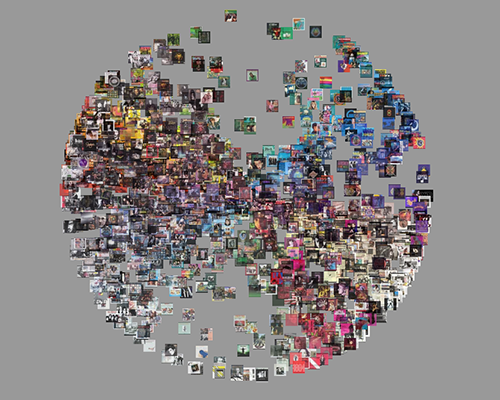
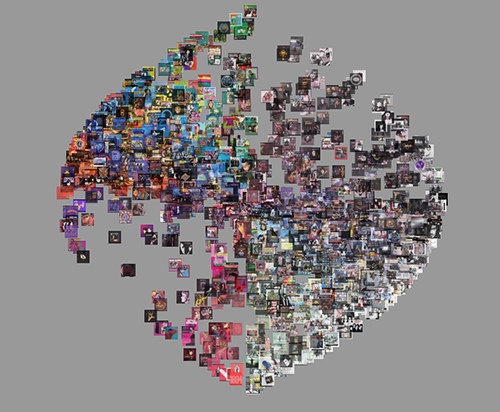
Radial plot of images
Images are plotted around polar coordinates, based on hue and saturation
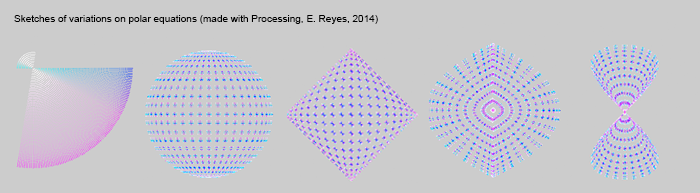
Disrupting and Experimental Media Visualizations
What if we produce different representations by modifying the fundamental formulae of polar equations?
r2 = x2 + y2 x = r cos(θ) y = r sin(θ)
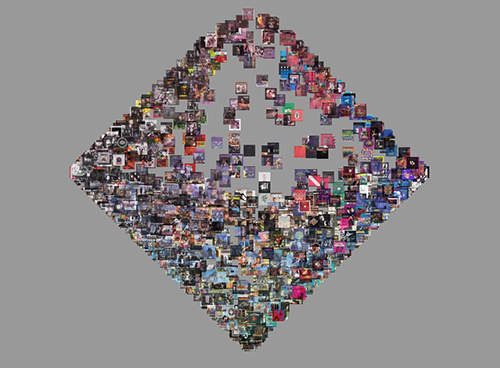
Tetradic plot of images
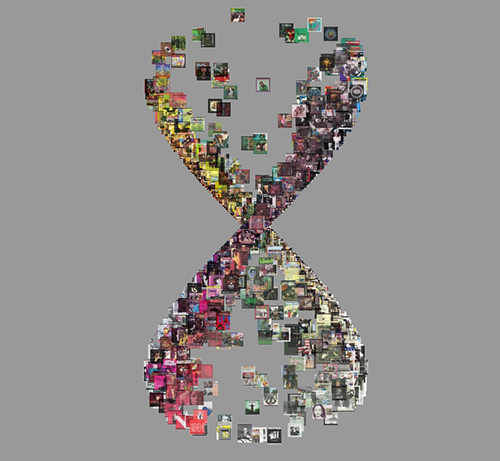
Rose-infinite plot of images
Cosine plot of images variation 01
Cosine plot of images variation 02
Technical Documentation
- Data was gathered through the Rovi Cloud Services in April 2013.
- I requested the list of most significant albums by genres ids in JSON format. For example: /significantalbums?genreids=ma0000004443, where ma0000004443 is the id of Contemporary Pop/Rock
- Images were measured with ImageMeasure, a script for ImageJ written by members of the Software Studies Initiative lab.
- Pixelisation was made with Adobe Photoshop 13.0 with Filter --> Pixelate --> Mosaic
- Montage of images was calculated with ImageMontage 1.1, a script for ImageJ written by Lev Manovich, Mathias Giachino and some modifications made by me.
- Cartesian 360 degree tranformation of monatages was done with the plugin Polar Transformer for ImageJ.
- Plot of images was calculated by scaling the lenght of pixels vs. the years.
- Radial plots and disrupting-experimental plots were calculated by me.
- Generation of HTML for interactive visualizations was made with Open (Google) Refine 2.5.
- Cropping and scaling of albums covers images was made with Apple Automator 2.4.
- Web interface and interactive web-based media visualization were developed by me, coding mostly in Adobe Dreamweaver 12.0
Further Reading and Viewing
- A gallery of larger images is availble from Flickr.
- Manovich, L. (2012). "Media Visualization: Visual Techniques for Exploring Large Media Collections", in Gates, K. (ed.) Media Studies Futures, Blackwell. [ download: DOC, 137 Kb. ]
- Manovich, L. & Reyes, E. (forthcoming 2014). “Info-aesthetics”, in Veyrat, M. (ed.) 100 Notions for Digital Art. Paris, Les Editions de l’Immatériel.
- Reyes, E. (2013). "On Visual Features and Artistic Digital Images", in Proceedings of the ACM conference VRIC'13.
- Reyes, E. (2012). "Some preliminary notes for a semiotics for media visualizations", in 11th. World Congress on Semiotics, Nanjing, China.